
- Market cap
- $144.48M
- AI share
- 1.8%
- Volume (24h)
- $14.86M10.3% of cap
- Circulating supply
- 7.24Bof 34.36B max
- Fully diluted value
- $685.86M
PRICE HISTORY
Sentient price chart
MODEL SCENARIOS
Sentient price prediction
How far Sentient could move over the coming weeks and months, read from its own past year of daily moves, with the evidence behind each range. Recomputed daily.
- Actual
- Median
- 50%
- 80%
- 95%
$0.0196 median -1.6% · 80% band $0.009592–$0.043
Actual daily closes from Jan 22, 2026 to the $0.0199 reference close on Nov 18, 2026. The median and the 50%, 80% and 95% bands extend to Feb 16, 2027.
How this prediction is built
Dextape resamples Sentient’s own daily price changes to estimate a range of possible future prices. The model replays the observed daily returns in random order along 1,200 paths, then reads the spread of outcomes at each day of the horizon. It shows how wide outcomes have been, not where the price will go, and it is not investment advice.
- 01Return sample300 days
300 observed daily log returns from the trailing year, used as drawn.
- 02Bootstrap paths1,200 paths
Seeded resampling, so the same inputs always give the same bands.
- 03Historical replay80% inside
5 past windows re-run with the same method; a calibrated 80% band holds about 80% of realised closes.
Model sensitivities
| Horizon | Median | 80% band width | Replay coverage |
|---|---|---|---|
| 7D | $0.0196 | ±20.0% | 81% of 58 |
| 30D | $0.0196 | ±45.7% | 73% of 22 |
| 90D | $0.0196 | ±83.9% | 80% of 5 |
| 1Y | $0.0182 | ±194.3% | — |
Band width grows roughly with the square root of the horizon, as expected for independent daily draws.
Technical details
Log returns from the trailing 300 daily closes are drawn with replacement (a stationary bootstrap with a fixed seed per asset, horizon and reference date, so the output is reproducible). Percentiles of the cumulative return across paths form the 50%, 80% and 95% bands. The historical replay refits the same method on rolling 120-day windows of the past year and counts how often the realised close landed inside the 80% band. No drift, volatility clustering or external signals are modelled.
Risks and limitations
- The sample is one year of this asset’s history. Events outside it, such as a delisting, an exploit or a regime change, are not represented.
- Daily returns are drawn independently, so volatility clustering and trends are understated. Real drawdowns can run deeper and longer than the bands.
- The bands describe the model’s outcomes. They are not a probability that the price reaches any level, and nothing here is a recommendation.
Probabilistic scenario analysis from public CoinGecko daily closes, recomputed daily. Not a guarantee or investment recommendation.
MARKET SIGNAL
Why Sentient reads neutral
Momentum supports the reading: 4 of 5 windows, 30-day move weighted highest. The evidence below produces a neutral reading of current conditions, not a price forecast.
Score drivers i
- Momentum55% weight+6.3 pts
- Historical position20% weight-2.1 pts
- Milestone recency15% weight0 pts
- Volume confirmation10% weight+5 pts
Historical position i
39% of the way from the all-time low to the high, on a log scale.
Momentum evidence i
- 24h
- +8.00%
- 7d
- +20.37%
- 30d
- -8.58% Highest weight
- 200d
- +15.38%
- 1y
- —
Market context · not scored
- Volume (24h)
- $14.86M
- Turnover
- 10.29%
- Overall rank
- #191
- Circulating supply
- 7.24B
How this score is calculated Model v1.0
The score starts at a neutral 50 and adds four bounded drivers. Momentum (55%) blends the 24h, 7d, 30d, 200d and 1y moves; each passes through a saturating curve (tanh of the move over a per-window scale of 5, 12, 25, 50 and 80 points) and is weighted 10, 20, 40, 20 and 10 percent. Historical position (20%) maps the log-scale position between the all-time low and high onto −10 to +10 points. Milestone recency (15%) adds up to 7.5 points for an all-time high inside the past 30, 90 or 365 days and subtracts the same for a recent low. Volume confirmation (10%) adds up to 5 points in the direction of the day’s move once 24h turnover exceeds 2% of market value, saturating at 10%.
Readings of 60 or more are labelled bullish, 40 or less bearish. Missing inputs contribute zero and lower the reported data coverage instead of being guessed.
TODAY’S TRADING
Sentient market analysis
Price movement i
90% of the way from the day's low to its high · 9.84% range width
- 1h
- +0.63%
- 24h
- +8.00%
- 7d
- +20.37%
- 30d
- -8.58%
- 200d
- +15.38%
- 1y
- —
Trading activity is active i
- Turnover
- 10.29%24h volume ÷ market cap. Above 8% reads as active, below 2% as quiet.
- 24h range
- 9.84%High minus low as a share of the current price.
- Range position
- 90%0% is the day's low, 100% the high.
- Rank in AI
- 13 of 208By 24-hour price change among tracked peers.
Volume is reported activity, not order-book liquidity. These figures describe observations, not a recommendation.
What if the price moves?
Change per SENT: $0.001996. A calculation, not a prediction.
WHERE IT TRADES
Sentient markets
Exchange pairs reported by CoinGecko. Venues that are unrated, stale, anomalous or wide-spread stay hidden until you ask for them.
| Exchange | Pair | Price | 24h volume | Spread | Trust |
|---|---|---|---|---|---|
| Binance | SENT/USDT | $0.0199 | $2.95M | 0.10% | Established |
| Binance | SENT/TRY | $0.0199 | $1.45M | 0.22% | Established |
| Bybit | SENT/USDT | $0.0199 | $1.19M | 0.07% | Established |
| OKX | SENT/USDT | $0.0199 | $717.2K | 0.10% | Established |
| KuCoin | SENT/USDT | $0.0199 | $585.47K | 0.10% | Established |
| Coinbase Exchange | SENT/USD | $0.0199 | $485.41K | 0.10% | Established |
| Gate | SENT/USDT | $0.0199 | $326.91K | 0.15% | Established |
| Bitget | SENT/USDT | $0.0199 | $202.93K | 0.07% | Established |
| Kraken | SENT/USD | $0.0199 | $168.77K | 0.05% | Established |
| Binance | SENT/USDC | $0.0199 | $94.54K | 0.15% | Established |
| Kraken | SENT/EUR | $0.0199 | $24.89K | 0.08% | Established |
| OKX | SENT/USDC | $0.0199 | $16.63K | 0.75% | Established |
| OKX | SENT/EUR | $0.02 | $6.21K | 0.55% | Established |
| OKX | SENT/TRY | $0.0199 | $602.56 | 1.08% | Established |
FOLLOW THE STORY
Market headlines
Nothing on the wire mentions Sentient right now. These are the newest general market stories; they are not about Sentient.
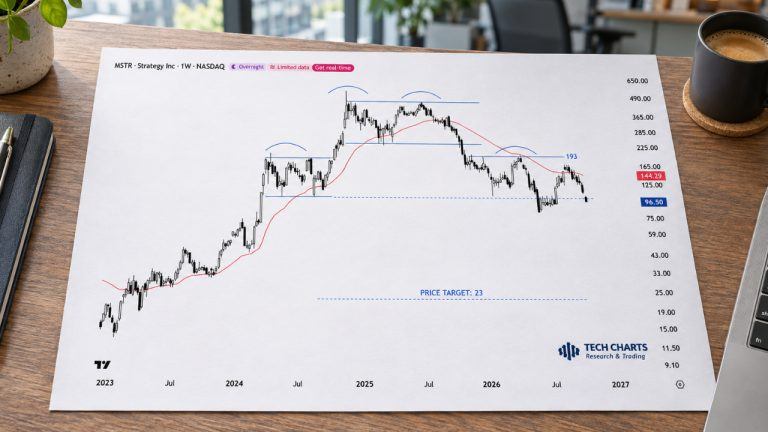 Bitcoin Giant Strategy’s Shares Could Drop 75% to $23 Amid Bearish Pattern: Analyst
 Solana says account rent could fall 86%: what would users pay?
 MARA prices $185M debt offering after $1.1B Bitcoin sale
 S&P Global Ratings downgrades Tether’s USDT peg assessment to weak
 Astra vs. Fable: What Document and Knowledge Tests Show
 Fed's Waller Calls for 50-Basis-Point Rate Hike, Says Tokenized Finance Still Needs Traditional Banks
THE BASICS
About Sentient
Sentient is building the world’s first open and community-built AGI platform, an open-source intelligence network designed to rival and complement the closed systems from OpenAI, Anthropic, Google, and others. Through the Sentient GRID, 100+ partners collaborate across agents, models, data, and compute to create a decentralized alternative to closed AGI labs. Sentient addresses the most urgent risk of our time: closed-source AGI.
Today, a handful of corporations are building AGI in secret, deciding what it knows, how it thinks, and who it serves. AGI is the most powerful technology humanity has ever created. If controlled by a few, it could lock the future into their hands, creating a fundamental threat to society. Sentient’s mission is to ensure AGI is open, community-built, and not controlled by a single entity. We are achieving this through THE GRID: the world’s largest open network of intelligence.
The GRID is the first real step toward open-source AGI: a decentralized fabric of specialized agents, models, datasets, tools, and compute—contributed by the world’s best builders—working together as one to deliver high-quality results.
Sentient price today
Sentient (SENT) is trading at $0.02, up 8.00% in the last 24 hours. It ranks #191 by market cap, at $144.48M, with $14.86M traded in 24 hours. Read from CoinGecko at 18:38 UTC on November 18, 2026.
| Sentient price | $0.02 |
|---|---|
| 24h change | +8.00% |
| 24h low / high | $0.0182 / $0.0202 |
| Market cap | $144.48M |
| Market cap rank | #191 |
| 24h volume | $14.86M |
| Circulating supply | 7.24B SENT |
| Total supply | 34.36B SENT |
| Maximum supply | 34.36B SENT |
| Fully diluted value | $685.86M |
| All-time high | $0.0481 · January 31, 2026 |
| All-time low | $0.0113 · July 29, 2026 |
Sentient questions
What is the price of Sentient today?
Sentient (SENT) is trading at $0.02, up 8.00% in the last 24 hours, read from CoinGecko at 18:38 UTC on November 18, 2026. In the last 24 hours it traded between $0.0182 and $0.0202.
What is Sentient's market cap?
$144.48M, which ranks Sentient #191 by market capitalisation. Market cap is the price ($0.02) multiplied by the circulating supply (7.24B SENT). It measures the value of units in circulation, not money invested.
How many Sentient are there?
7.24B SENT are in circulation, of a total supply of 34.36B. The maximum supply is 34.36B SENT, so 21.1% of it is already in circulation.
What is Sentient's all-time high?
$0.0481, reached on January 31, 2026. At $0.02, Sentient trades 58.5% below that high.
How much Sentient was traded in the last 24 hours?
$14.86M, equal to 10.3% of its market cap, across the exchanges CoinGecko tracks. Reported volume varies by venue and can be inflated; it is not the same as liquidity.
Why can SENT prices differ between exchanges?
Each venue has its own order book, fees and liquidity. Prices converge through arbitrage but can differ by the spread, especially on smaller venues. The markets section lists reliable venues first.
How fresh is this data?
Prices come from CoinGecko and refresh about every minute; each figure shows its source and when it was read. If the provider is unavailable, the page says so rather than showing a stale or invented number.
MARKET CONTEXT
More in AI
Other AI assets by market value, from the same CoinGecko snapshot.






COMPARE
Compare Sentient
Side by side with the largest assets: size, returns, supply and distance from all-time high.
How to read this market file
Prices, capitalization and volume come from the displayed CoinGecko snapshot. Market capitalization and exchange volume describe different measures; neither is available liquidity for an order. Missing measurements remain blank. The chart opens the exact asset ID: sentient.
Data sources and editorial standards →