Launch Survival Report · Weekly data
Launch Survival Report: Nov 2 – Nov 8, 2026
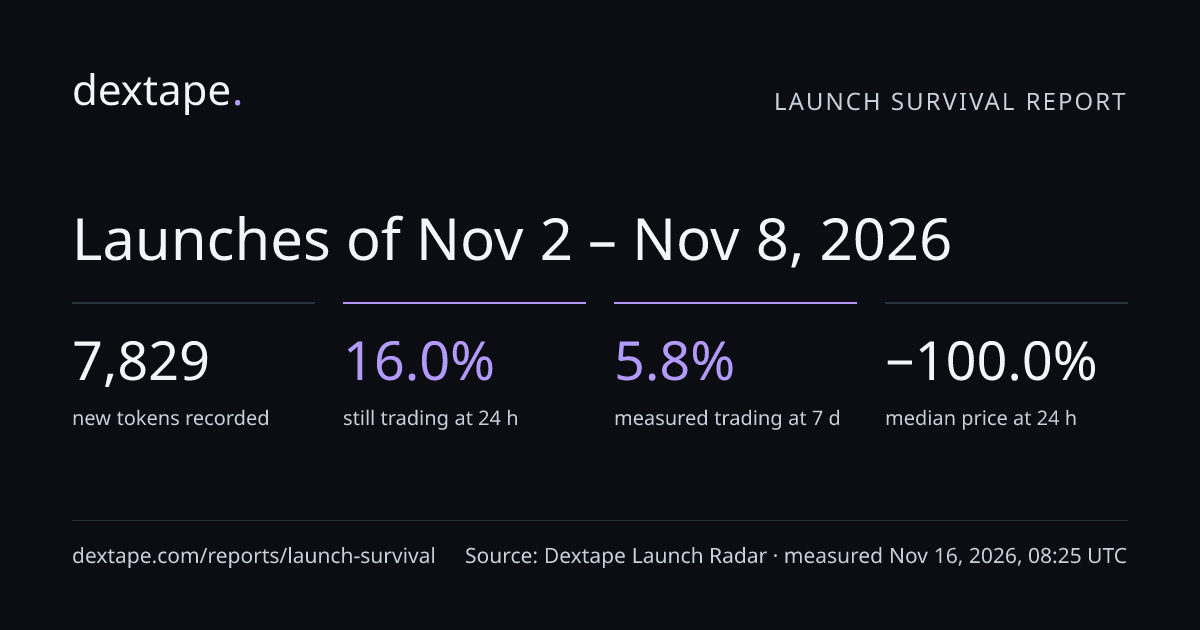
Dextape's Launch Radar recorded 7,829 new tokens on 6 chains. 16.0% still had trading liquidity 24 hours after launch; 5.8% were measured still trading at 7 days, and 92.7% had no 7-day reading.
Source: Dextape Launch Radar checkpoint readings (GeckoTerminal and DexScreener market data). Measured .
24 hours and 7 days after launch
Each launch's liquidity at the checkpoint, compared with its launch reading. Shares are of all 7,829 launches.
- Still trading
- Under $500 liquidity
- Liquidity down 90%+
- No reading
| Outcome | 24 hours | 7 days |
|---|---|---|
| Still tradingLiquidity of at least $500 and at least 10% of the launch reading. | 16.0%1,250 | 5.8%456 |
| Under $500 liquidityLiquidity under $500 but at least 10% of the launch reading. | 0.1%8 | 0%0 |
| Liquidity down 90%+Liquidity under 10% of the launch reading. | 58.2%4,559 | 1.5%117 |
| No readingNo market reading within 6 hours of the checkpoint, or no launch reading to compare with. | 25.7%2,012 | 92.7%7,256 |
From 24 hours to 7 days
Launches by their 24-hour outcome (rows) and their 7-day outcome (columns).
| At 24 hours | Still trading | Under $500 liquidity | Liquidity down 90%+ | No reading |
|---|---|---|---|---|
| Still trading | 439 | 0 | 20 | 791 |
| Under $500 liquidity | 0 | 0 | 0 | 8 |
| Liquidity down 90%+ | 0 | 0 | 84 | 4,475 |
| No reading | 17 | 0 | 13 | 1,982 |
Source: Dextape Launch Radar checkpoint readings (GeckoTerminal and DexScreener market data). Measured .
By chain
| Chain | Launches | Share of week | Trading at 24 h | Trading at 7 d | No 7-day reading |
|---|---|---|---|---|---|
| BNB Chain | 3,442 | 44.0% | 2.6%91 | 1.8%62 | 97.1% |
| Base | 2,729 | 34.9% | 35.4%967 | 11.7%319 | 87.9% |
| Solana | 1,255 | 16.0% | 3.8%48 | 1.2%15 | 94.2% |
| Ethereum | 376 | 4.8% | 34.3%129 | 14.9%56 | 82.7% |
| Polygon | 15 | 0.2% | 33.3%5 | 20.0%3 | 80.0% |
| Arbitrum | 12 | 0.2% | 83.3%10 | 8.3%1 | 91.7% |
Source: Dextape Launch Radar checkpoint readings (GeckoTerminal and DexScreener market data). Measured .
By venue
The DEX or launchpad of the first pool the radar recorded for each token, as GeckoTerminal or DexScreener names it.
| Venue | Launches | Trading at 24 h | Liquidity down 90%+ at 24 h | Trading at 7 d |
|---|---|---|---|---|
| PancakeSwap v2BNB Chain | 3,398 | 2.4%80 | 73.0% | 1.7%58 |
| Uniswap v4Base | 1,672 | 55.1%922 | 26.1% | 18.5%310 |
| Uniswap v2Base | 884 | 1.1%10 | 68.0% | 0.1%1 |
| PumpSwapSolana | 603 | 5.3%32 | 76.0% | 1.2%7 |
| Meteora DAMM v2Solana | 235 | 0.4%1 | 43.0% | 0.4%1 |
| Meteora DBCSolana | 220 | 0%0 | 95.9% | 0%0 |
| Uniswap v2Ethereum | 175 | 5.1%9 | 90.9% | 1.1%2 |
| Uniswap v4Ethereum | 128 | 49.2%63 | 28.1% | 22.7%29 |
| Uniswap v3Base | 126 | 8.7%11 | 0.8% | 1.6%2 |
| Raydium LaunchLabSolana | 106 | 0.9%1 | 0.9% | 0.9%1 |
| Other venues33 venues | 282 | 42.9%121 | 26.6% | 16.0%45 |
Source: Dextape Launch Radar checkpoint readings (GeckoTerminal and DexScreener market data). Measured .
By liquidity at launch
The pool liquidity in the launch reading. The median launch started with $36k of pool liquidity.
| Launch liquidity | Launches | Trading at 24 h | Liquidity down 90%+ at 24 h | Trading at 7 d |
|---|---|---|---|---|
| Under $25k | 2,425 | 8.5%206 | 51.8% | 1.9%47 |
| $25k–$50k | 2,167 | 6.0%129 | 64.1% | 1.8%40 |
| $50k–$100k | 1,592 | 23.2%370 | 66.1% | 8.0%128 |
| $100k–$250k | 932 | 42.5%396 | 42.3% | 18.7%174 |
| $250k and up | 713 | 20.9%149 | 65.5% | 9.4%67 |
Source: Dextape Launch Radar checkpoint readings (GeckoTerminal and DexScreener market data). Measured .
Price after launch
Medians across launches with a launch price and the later reading; checkpoints are the only prices used, so a peak between them is not seen.
- Price at 24 hours
- −100.0%Median of 5,817 launches with a reading.The 24-hour price against the launch price.
- Price at 7 days
- −16.1%Median of 573 launches with a reading.The 7-day price against the launch price.
- Peak
- −99.9%Median of 7,569 launches with a reading.The highest of the 1-hour, 24-hour and 7-day prices against the launch price.
- Drawdown
- −100.0%Median of 7,569 launches with a reading.The fall from the highest reading, launch included, to the last reading taken.
Source: Dextape Launch Radar checkpoint readings (GeckoTerminal and DexScreener market data). Measured .
Launches per day
New tokens first seen each day (UTC). The radar admits at most 12 new tokens every 10 minutes, so a day holds at most 1,728.
- 1,085Mon 2
- 1,139Tue 3
- 1,158Wed 4
- 1,147Thu 5
- 994Fri 6
- 1,030Sat 7
- 1,276Sun 8
Source: Dextape Launch Radar checkpoint readings (GeckoTerminal and DexScreener market data). Measured .
How this report is measured
- What is counted
- Tokens Dextape's Launch Radar first saw between Monday 00:00 and Sunday 23:59 UTC (7,806 from GeckoTerminal new pools, 13 from DexScreener token profiles, 10 from page visits). The radar admits a token once a pool holds at least $10,000 of liquidity and takes at most 12 new tokens every 10 minutes, deepest pools first. It is a sample of liquid launches, not every token created that week.
- Checkpoints
- Each launch is read when first seen and again at 1 hour, 24 hours and 7 days. A checkpoint reading must be taken within 6 hours of its due time. This week: 7,829 launch readings, 7,062 at 1 hour, 5,817 at 24 hours and 573 at 7 days.
- Outcomes
- Still trading. Liquidity of at least $500 and at least 10% of the launch reading.Under $500 liquidity. Liquidity under $500 but at least 10% of the launch reading.Liquidity down 90%+. Liquidity under 10% of the launch reading.No reading. No market reading within 6 hours of the checkpoint, or no launch reading to compare with. The rule is the same one behind the outcome on token pages and the “still trading” count in the Launches feed.
- No reading
- A launch without a reading is never counted as trading. The 24 hours to 7 days table shows the 24-hour outcome of every launch that has no 7-day reading.
- What it is not
- These are measured market facts about liquidity and price. They are not a judgment of any token, team, chain or venue, and not investment advice.
- Publication
- Each week is computed once, after its last 7-day checkpoint has closed, and is not edited afterwards. Method version 1.
Embed and data
Use this week's card on your site or in a post. It links back to this page and carries its source and measurement time.
Download the figures (JSON)